System Integration
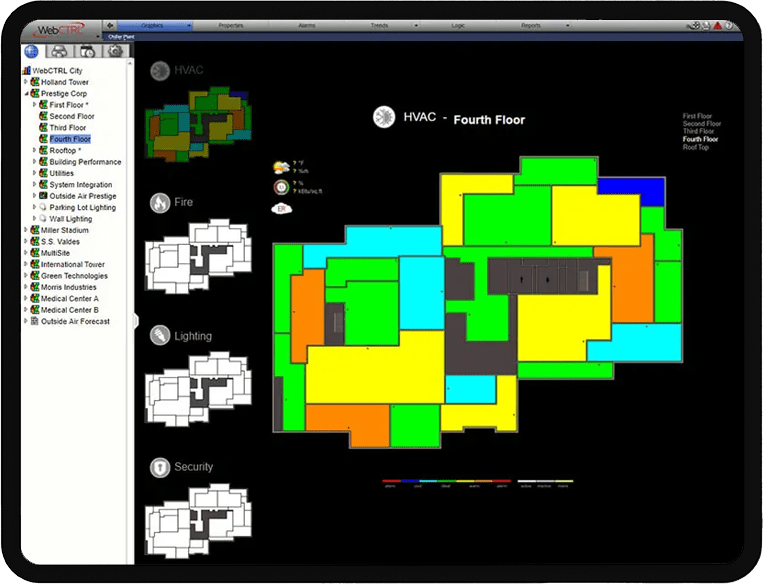
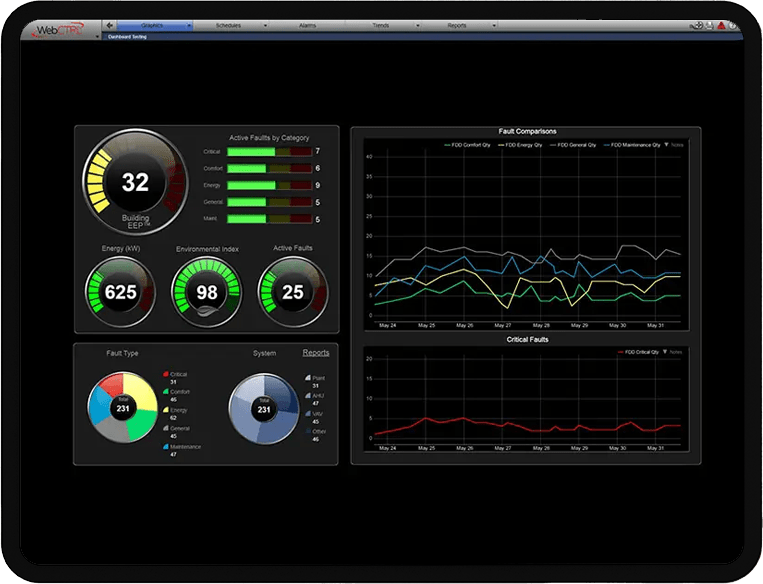
Our system integration solution brings together multiple providers and systems into a single, user-friendly web-based portal, offering a comprehensive automation system for your building.
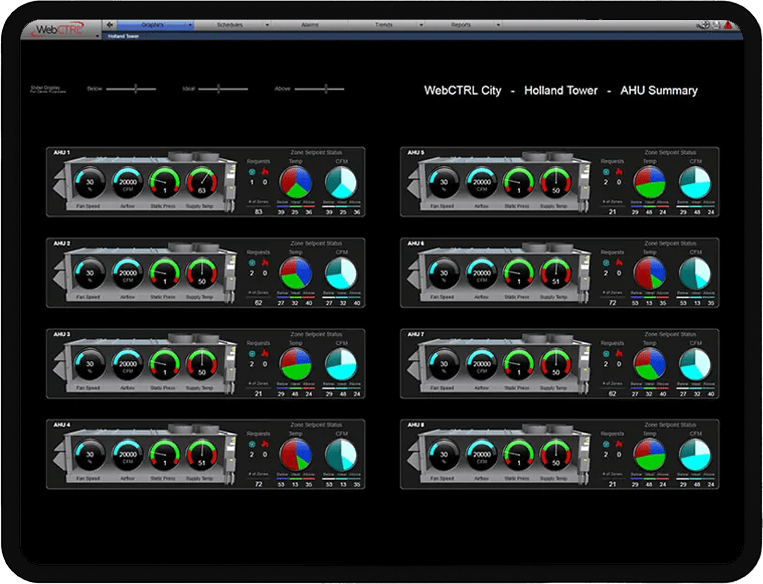
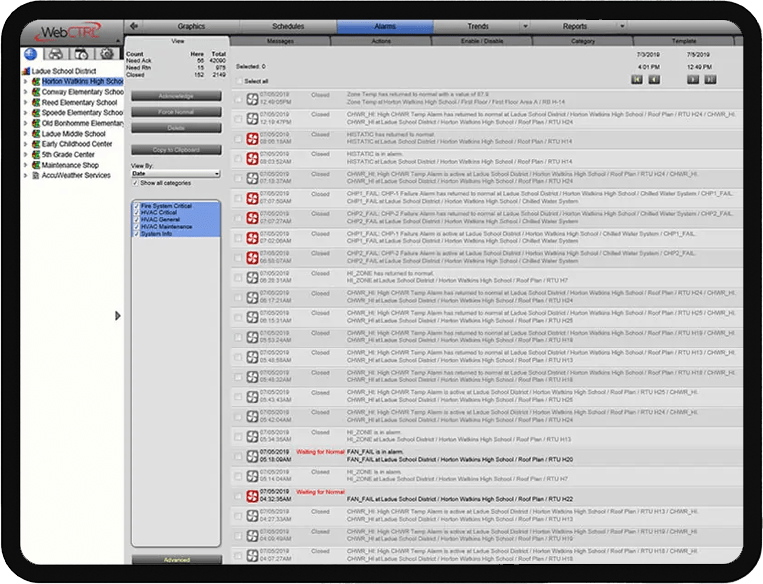
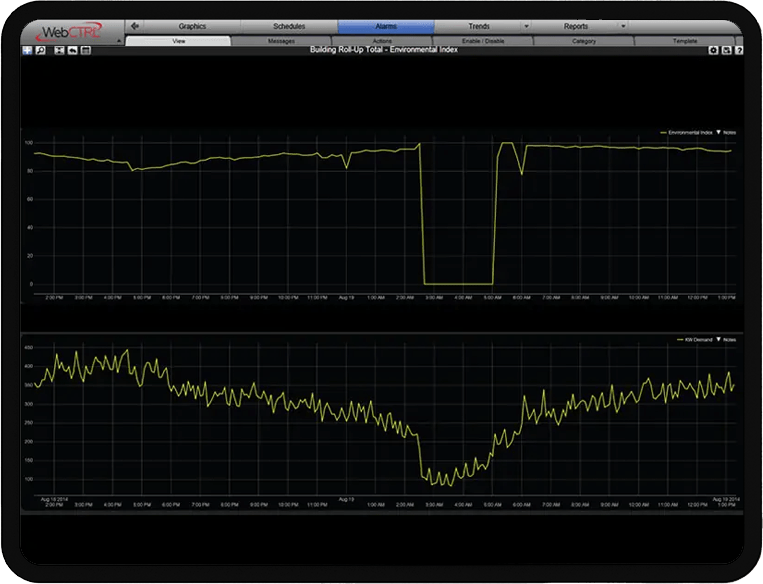
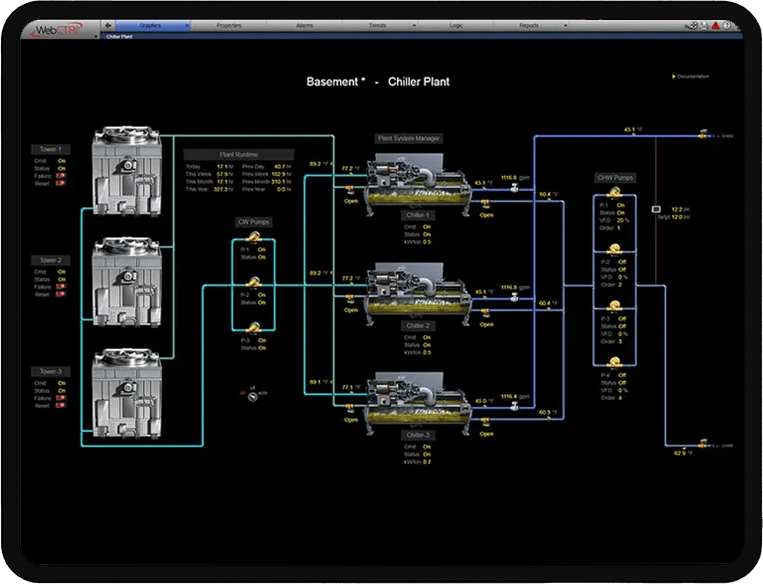
Our integrations cover a wide range of systems, including environmental, energy, security, safety, refrigeration, and other mechanical systems. The WebCTRL® system, powered by Automated Logic controllers, utilizes open protocols and is fully certified by the BACnet® Testing Laboratory (BTL).
This certification guarantees that our building automation systems meet interoperability standards, providing flexibility for customizing your system integration.