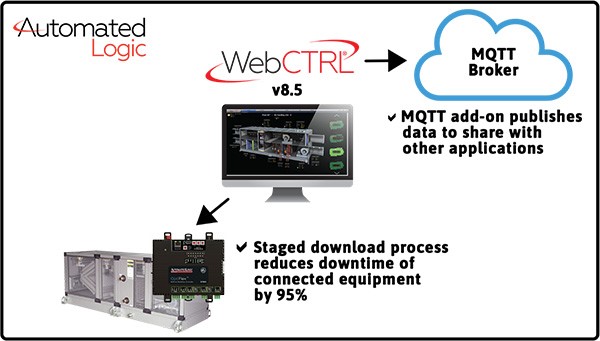
With the new EnergyReports™ for WebCTRL®, building owners and operators will be able to use their WebCTRL building automation system to securely push data from a single building or a portfolio of buildings to the cloud. From there, they can create graphs, charts, reports and dashboards to visualize the building data, which will enable them to:
- Convert energy consumption data to cost or carbon dioxide emissions
- Benchmark building performance data against ENERGY STAR® scores
- Analyze and normalize energy consumption across buildings
- Identify performance issues to maximize building efficiency
- Improve occupant comfort, productivity and engagement
- Compare energy costs across buildings
- Drive energy conservation measures
EnergyReports for WebCTRL is available in three editions:
Eco-Screen® Edition
The EnergyReports™ Eco-Screen® Edition allows you to engage building occupants by showcasing your building’s energy conservation and sustainability measures. It’s an innovative way to bring your building to life, making its behind-the-scenes workings engaging and interactive.
Dashboards Edition
Building upon the EnergyReports™ Eco-Screen®, the EnergyReports Dashboards Edition leverages the WebCTRL building automation system to deliver a 360-degree view of building performance so stakeholders can meet their energy conservation and savings objectives. The EnergyReports Dashboards Edition allows operators to create and share graphs, charts, reports and dashboards to visualize building data.
Analytics Edition
The EnergyReports™ Analytics Edition builds upon the EnergyReports Dashboards Edition by adding several key analysis and visualization capabilities for advanced energy management across your building portfolio. Leverage advanced analytics, machine learning, and actionable insights to reduce costs, save time, and forecast and track performance.


